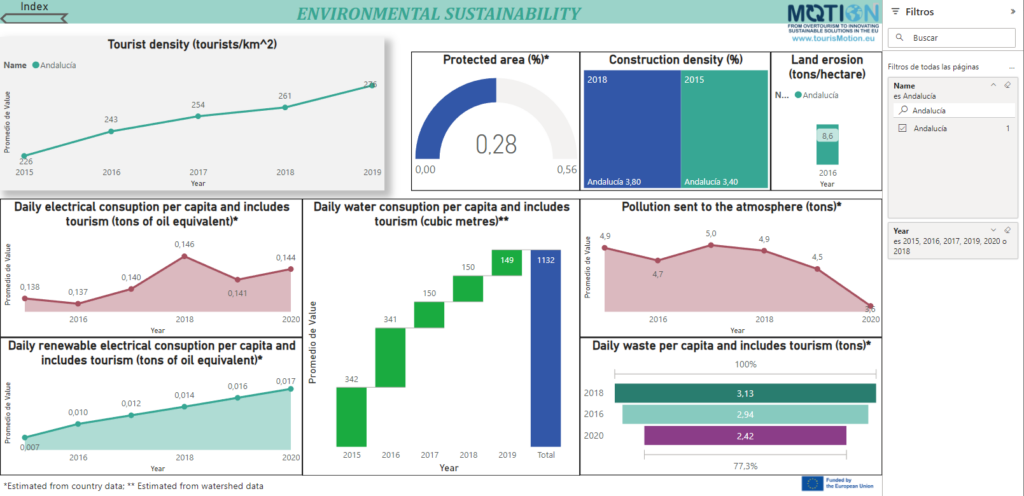
The tool is designed to extract NUT 2 level information from Eurostat for the 242 regions in the European Union, each region have 22 indicators, and the time period for the data is from 2015 to 2020. The dashboard can be updated with fresh data every year. The indicators are divided into three dimensions: environmental, economic and social sustainability. Also includes an interpretation guide to help users to understand the graphs.
What´s it good for?
The goal of this tool is to facilitate visualizing large quantities of data in a coherent manner. Althought threre is a lot of information about sustainability in destinations, this information is not homogeneous and available in a single place. This tool comes to solve this gap.
Next steps
We are trying to include in the dashboard a simulation application that allow business managers, policy-makers and students to test some strategies to improve sustainability and predict the results of its implementation.